›
›
›
›
Marketing process research 2026: the B2B operator's guide
Marketing process research 2026: the B2B operator's guide
Marketing process research 2026: the B2B operator's guide
Marketing process research 2026: the B2B operator's guide
Marketing process research 2026: the B2B operator's guide
Marketing process research 2026: the B2B operator's guide

Author
Aljaz Peklaj

Your pipeline dashboard says the team is productive. Reply rates look healthy, calendars are full, and AEs have enough meetings to stay busy. Revenue still sits flat because the workflow is leaking value between interest, attendance, qualification, and closed-won business.
Review the seven internal metrics that reveal where the funnel breaks.
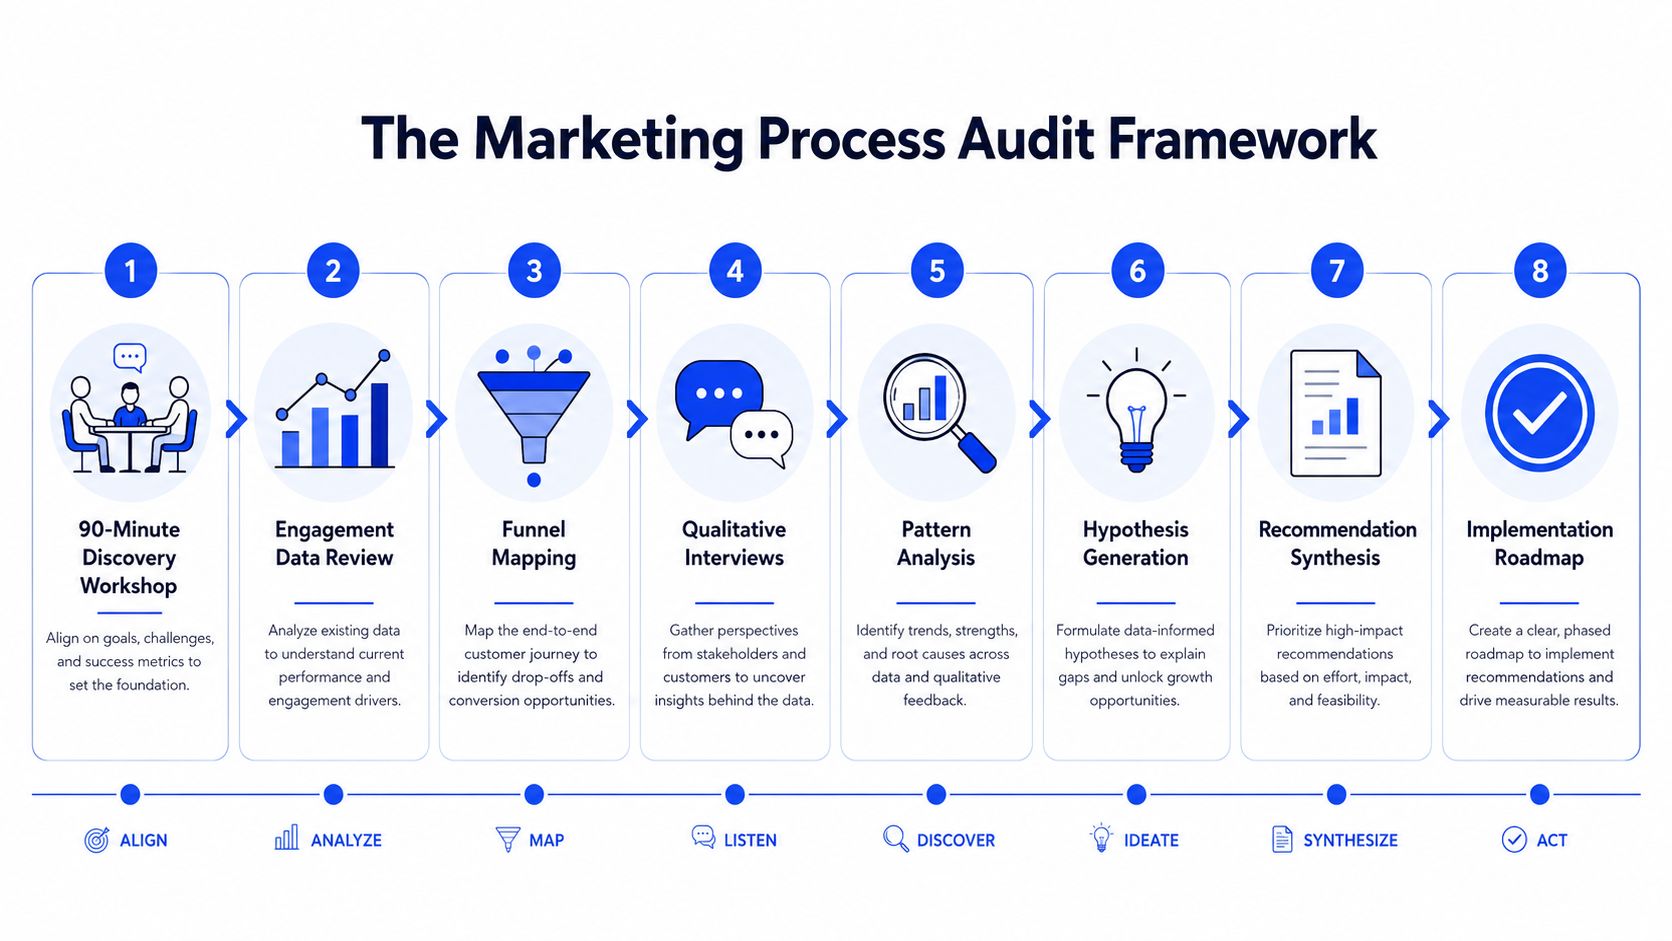
Run an eight-step audit across data, tools, messaging, signals, handoff, and reporting.
Use qualitative research to expose bottlenecks hidden by surface activity.
Reverse-engineer closed-won deals so targeting and messaging reflect buying patterns, not assumptions.
Prioritize interventions by downstream impact, not by the volume of activity they create.
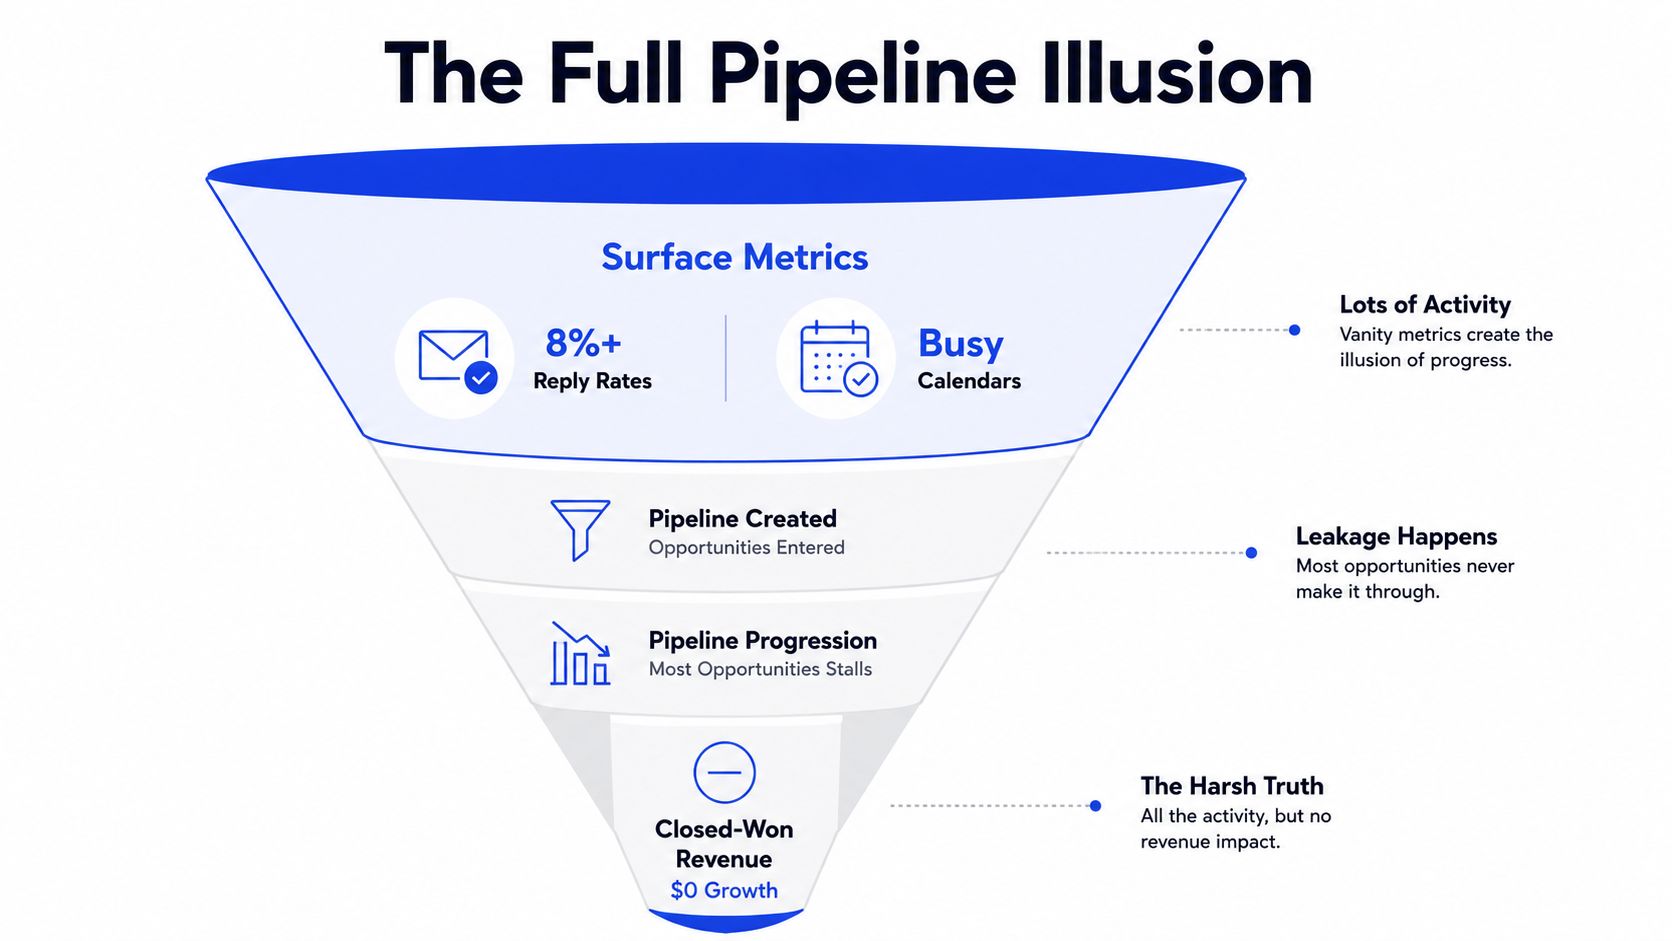
This is the operating problem behind most marketing process research. Teams report what happened at the top of the funnel, then treat the dashboard as a diagnosis. A useful process study works backward from qualified opportunities and revenue to identify the specific handoff, signal, or decision that failed.
If your reporting still separates marketing activity from sales outcomes, start by fixing the shared measurement layer. A practical guide to building a growth-driven dashboard can help you frame that work, while sales and marketing alignment depends on agreeing which events matter before either team changes execution.
Table of Contents
How a hidden qualification bottleneck stayed invisible for months
Your research-driven pipeline system and what to do this week
Why your pipeline looks full but revenue stays flat
The usual pattern is easy to recognize. A SaaS team sends targeted sequences through Lemlist, adds LinkedIn touches through Sales Navigator, and watches replies arrive in HubSpot. A manufacturing team sees prospects accept meetings, while a legal tech team reports strong engagement from accounts that never progress beyond an introductory call.
The problem usually isn't a lack of activity. It's that the process measures attention without decision quality. A positive reply can come from someone without buying authority. A held meeting can involve a curious evaluator who has no project, budget, or internal mandate. A booked meeting can still fail because routing takes too long or scheduling creates friction.
Operator rule: Treat every upstream metric as a hypothesis about revenue, not proof of revenue.
Marketing process research should answer four questions in order: where does conversion fall, why does it fall, which signals predict qualified demand, and what intervention can change the result? That sequence prevents the common mistake of buying another tool before checking whether the current workflow records the necessary events.
The global marketing research industry was valued at about $67.5 billion in 2023 and projected to grow at roughly 7.4% annually from 2024 to 2032, according to WorldMetrics' marketing research industry data. The scale matters less than the implication. Research has moved from occasional campaign feedback into a serious operating function for decisions across major markets.
GROU works from that operating view across iGaming, SaaS, manufacturing, legal tech, and pharma. The job is to connect one target list, one message system, one outbound workflow, and one reporting line, then trace each intervention to pipeline quality.
The seven internal metrics to review first
Start with the complete funnel, not open rates or impressions. Export the relevant records from HubSpot, Apollo, Lemlist, Instantly, Smartlead, HeyReach, or the systems your team uses, then define each event before calculating it.
The priority order below prevents a weak metric from hiding a serious downstream problem.
Priority | Metric | What it reveals |
|---|---|---|
1 | End-to-end conversion rates | The exact stage where value drops |
2 | Cost per qualified opportunity | Whether the campaign makes economic sense |
3 | Deliverability and sender reputation | Whether outreach can reach inboxes reliably |
4 | Sales cycle length by stage | Where deals stall and forecasts weaken |
5 | Qualification rate and deal quality | Whether meetings reflect genuine opportunity |
6 | Engagement patterns and response quality | Whether prospects experience relevant outreach |
7 | Attribution and multi-touch patterns | Which channels and signals contribute to pipeline |
Start with conversion economics
Map prospect-to-reply, reply-to-positive-reply, positive-reply-to-meeting-booked, meeting-booked-to-meeting-held, meeting-held-to-qualified-opportunity, and qualified-opportunity-to-closed-won. Review the overall prospect-to-closed rate as well.
Each break points to a different intervention. Weak replies usually suggest targeting or messaging problems. Weak meeting conversion often points to response management. Weak show rates suggest scheduling or expectation issues. Weak qualification can expose poor targeting or inadequate meeting preparation.
Next, calculate cost per qualified opportunity, using fully loaded campaign investment divided by qualified opportunities. Early metrics can look healthy while this measure exposes an uneconomic process. It belongs near the top because it connects execution to pipeline value.
Check the foundation before changing copy
Deliverability comes third because poor sender reputation invalidates downstream analysis. Review bounce rate, spam complaints, domain reputation, inbox placement estimates, and SPF, DKIM, and DMARC alignment. The internal benchmark supplied for this audit framework is a bounce rate under 2%, ideally under 1%, and a spam complaint rate under 0.05%, as outlined in the B2B marketing benchmark guidance.
Then inspect sales cycle length by stage, from first outreach to meeting, meeting to qualified opportunity, qualified opportunity to proposal, and proposal to close. Total cycle length can look normal while one stage consumes forecast time.
Measure quality and channel contribution
Qualification rate, average deal size, win rates on qualified opportunities, and closed-won versus closed-lost characteristics tell you whether the ICP is producing real buying situations. Engagement quality adds context through response type, response timing, comment substance, and post-meeting behavior.
Attribution comes last in the initial pass because it's difficult to interpret before the funnel and definitions are stable. Review first touch, multi-touch contribution, content engagement, referrals, cold sources, and interactions between LinkedIn and email. Teams that need a sharper KPI hierarchy can use this lead generation KPI framework as a reference, then adapt the definitions to their CRM.
The eight-step marketing process audit
A useful audit produces documents, not a collection of opinions. GROU's onboarding audit focuses on outbound and pipeline generation, rather than paid media, SEO, or brand operations outside the planned intervention.
1. Establish the current state
The process starts with a 90-minute discovery workshop. The client CEO or founder, sales leadership, marketing leadership, our engagement lead, and our strategist review the current pipeline approach, team responsibilities, outbound tools, CRM flow, reporting cadence, historical data, goals, and stated challenges.
The output is a current state overview. Skipping this meeting creates a predictable failure: analysts interpret symptoms without understanding ownership, constraints, or the decisions the team already made.
2. Review historical performance
A 5 to 10 hour review covers the last 6 to 12 months of campaign data. We inspect reply, meeting, qualification, close, attribution, deal size, and revenue patterns, using CRM exports, outbound reports, marketing analytics where available, and closed-won and closed-lost analysis.
The deliverable is a performance baseline. It should show where the process works, where it stalls, and which definitions need correction.
3. Audit tools and integrations
Over 3 to 5 hours, review HubSpot or Salesforce, Lemlist, Instantly, Outreach, Sales Navigator, HeyReach, Apollo, ZoomInfo, Clay, reporting infrastructure, Slack, and related systems. Check whether data flows correctly, whether manual work creates delays, and whether duplicate tools obscure ownership.
The output is a tool stack and integration report. A diagram of the current sales process flow chart makes missing handoffs easier to discuss with sales and RevOps.
4. Examine content and messaging
A 4 to 6 hour messaging audit covers subject lines, open rates, body copy, personalization depth, CTAs, sequence cadence, channel coordination, and voice consistency. The question is whether the message reflects the account's situation, not whether it contains a token first-name field.
This produces a messaging audit report. Use evidence from replies and qualified meetings, not internal preference.
5. Inspect prospect intake and signals
Spend 3 to 5 hours examining whether prospects enter through static lists or signal-triggered intake. Review signal quality, enrichment, verification, ICP clarity, prospect volume, and quality measures.
Clay can support signal-based research and enrichment, but a signal isn't useful because it sounds relevant. It needs validation against qualified opportunities and closed-won deals.
6. Audit the sales handoff
A 2 to 4 hour review follows positive replies into sales. Check routing timing, AE preparation, meeting scheduling, follow-up cadence, and deal management discipline. The output is a handoff assessment.
Research teams should also apply basic quality checks for market research data, especially around sampling, missing values, inconsistent definitions, and response quality.
7. Review measurement and reporting
Over 3 to 5 hours, inspect leading and lagging indicators, attribution, reporting frequency, and how metrics drive decisions. The output is a measurement infrastructure assessment.
8. Synthesize the intervention
The final step takes 8 to 12 hours. Findings become a prioritized recommendations document covering current state, bottlenecks, improvement opportunities, intervention approach, expected impact, timeline, investment, and measurement criteria.
Across all eight steps, the total audit typically requires 30 to 50 hours across 2 to 3 weeks, with 8 to 12 hours from client stakeholders. The final report should contain an executive summary, current state assessment, gap analysis, recommendations, and measurement framework.
How a hidden qualification bottleneck stayed invisible for months
A manufacturing client had what looked like a healthy outbound system. Reply rate was 13.2%, positive reply rate was 68%, meeting booking rate was 72%, and meeting show rate was 88%. Qualification rate was only 34%, below the expected 55% to 65% range, so the team was creating interest without enough genuine opportunity.

A routine monthly dashboard review didn't expose the problem. The research had to move from quantitative surface metrics into meeting recordings, closed-deal comparison, signal-to-outcome attribution, and structured conversations with the sales team.
What the deeper review found
We reviewed 20 meetings across successful and unsuccessful outcomes. Interested prospects often weren't decision-makers, while the signal system treated broad topic interest as evidence of buying readiness.
Manufacturing context made the interpretation harder. Prospects accepted meetings out of professional courtesy and genuine interest, so a high show rate didn't mean the meeting involved authority, urgency, or an active project. The team had also carried SaaS assumptions into a vertical with different meeting behavior.
Closed-won analysis clarified the characteristics that separated viable opportunities from curious participants. Signal attribution then showed which inputs produced qualified conversations and which created activity without commercial intent.
High engagement tells you a prospect noticed the topic. It doesn't prove the prospect can buy.
The resolution combined several interventions. Signal criteria were refined, weak signals were removed, Claygent queries checked buying authority, and disqualification signals filtered prospects before meeting acceptance. The booking flow added authority and timeline questions, while meeting agendas addressed qualification earlier.
The team also added qualification rate to weekly monitoring, introduced alerts for degradation, and scheduled recurring deep analysis. After 60 days, qualification rate moved from 34% to 62%, while cost per qualified opportunity moved from €890 to €410. Those figures come from the supplied client example, not a universal benchmark.
Meeting volume decreased 15%, but qualified opportunity volume increased 63%. The lesson is direct: a full calendar can hide an intake problem, and lead qualification process research needs both conversation evidence and conversion data.
The closed-won reverse-engineering framework
Many teams research prospects before outreach and stop there. The more useful loop starts after the deal closes, then works backward through the account, buying group, signals, content, timing, and sales process.
The framework uses standard tools with custom configurations. HubSpot stores deal history, Clay supports enrichment and Claygent research, Notion records patterns and hypotheses, Google Sheets supports comparison, and LinkedIn Sales Navigator provides prospect and buying-group context. There isn't a proprietary AI model behind the method.
Profile the deals that actually closed
For every closed-won account, document the prospect profile, LinkedIn activity in the prior 6 months, company context, buying committee, decision timeline, and initial engagement source. Then compare patterns across deals rather than treating one account as proof.
This often changes the ICP. One client believed employee count defined its target market, but closed-won analysis indicated that funding stage was more predictive. Another client found that engagement with specific thought leaders mattered more than generic LinkedIn activity, producing a reported 45% improvement in qualified opportunity rate after targeting changed.
Turn patterns into tests
Generate hypotheses about buying readiness, ICP structure, committee composition, timing, competitive displacement, content engagement, and role tenure. Test each hypothesis by changing the target list, Clay research prompts, message angle, or sequence timing, then trace the outcome into qualification and closed-won data.
Examples from the supplied client work include identifying three-person buying committees, refining outreach around new-to-role leaders, and finding incumbent displacement patterns that changed positioning. One timing analysis found 78% of deals closed within Q1 or Q3, which led to a revised cadence.
The initial setup requires 26 to 42 hours, including closed-deal analysis, pattern documentation, and hypothesis development. Ongoing work requires roughly 60 to 90 hours annually, with monthly deal review and quarterly pattern refinement.
Research discipline: A hypothesis earns attention only after the CRM can connect it to an outcome.
This method compounds because each new closed deal adds evidence. It also keeps teams honest about the word “proprietary.” The tools are common. The value sits in disciplined reverse-engineering, client-specific judgment, and the willingness to revise assumptions.
Prioritising experiments after the audit
Fix the largest downstream leak first, unless a foundational issue blocks measurement. A practical priority score uses gap severity, pipeline impact, confidence in diagnosis, and intervention cost. A cheap copy test shouldn't outrank a broken reply-routing workflow when positive replies wait for human action.
For most B2B outbound systems, start with signal-based prospect intake when static lists produce weak qualification. Then address reply routing, AI-assisted personalization, meeting scheduling, meeting briefs, and integrated measurement according to the evidence from the audit.
A B2B SaaS audit illustrates the point. Signal-triggered intake through Clay, AI-enhanced personalization, automated Slack routing, meeting scheduling, AI-generated briefs, and integrated measurement were introduced after the audit identified multiple bottlenecks.
The reported movement was:
Reply rate: 6.4% to 15.8%, a 147% improvement.
Meeting rate: 58% to 74%, a 28% improvement.
Show rate: 68% to 84%, a 24% improvement.
Qualification rate: 42% to 68%, a 62% improvement.
Cost per qualified opportunity: €890 to €340, a 62% reduction.
These figures describe that supplied client intervention, not a standard outcome for every account. They show why sequencing matters. Better personalization can't repair poor intake, and better routing can't compensate for a list that produces interested people without buying authority.
For teams exploring AI-assisted search and content workflows, the Nuwtonic Agentic AI SEO Platform is one adjacent option to assess. Keep it separate from the outbound diagnosis unless the audit shows that search visibility or AI-mediated discovery affects the same buying path.
Your research-driven pipeline system and what to do this week
The operator view is simple. Review the seven metrics in priority order, run the eight-step audit when baseline data is missing, reverse-engineer closed-won deals monthly, and rank interventions by downstream gap rather than activity volume.
This approach works across SaaS, iGaming, manufacturing, legal tech, and pharma because it starts with the account's actual workflow. It also gives sales and marketing a shared evidence base for lead generation, instead of separate activity reports.
This week, export your last quarter of closed-won deals from HubSpot and tag each account by source signal, buying committee, role tenure, first meaningful engagement, and qualification outcome. Compare those tags with closed-lost deals, then choose one signal to test and one downstream metric to monitor.
GROU is a global B2B pipeline agency serving teams across iGaming, SaaS, manufacturing, legal tech, and pharma. Its methodology combines funnel diagnostics, tool and integration audits, qualitative review, closed-won reverse-engineering, and prioritized intervention measurement.
Grou helps B2B teams connect LinkedIn content, lead generation, and outbound into one pipeline system, with clear qualification rules and reporting tied to revenue outcomes. Visit Grou to assess the bottleneck in your current workflow and turn the findings into a measured intervention plan.
Your pipeline dashboard says the team is productive. Reply rates look healthy, calendars are full, and AEs have enough meetings to stay busy. Revenue still sits flat because the workflow is leaking value between interest, attendance, qualification, and closed-won business.
Review the seven internal metrics that reveal where the funnel breaks.
Run an eight-step audit across data, tools, messaging, signals, handoff, and reporting.
Use qualitative research to expose bottlenecks hidden by surface activity.
Reverse-engineer closed-won deals so targeting and messaging reflect buying patterns, not assumptions.
Prioritize interventions by downstream impact, not by the volume of activity they create.
This is the operating problem behind most marketing process research. Teams report what happened at the top of the funnel, then treat the dashboard as a diagnosis. A useful process study works backward from qualified opportunities and revenue to identify the specific handoff, signal, or decision that failed.
If your reporting still separates marketing activity from sales outcomes, start by fixing the shared measurement layer. A practical guide to building a growth-driven dashboard can help you frame that work, while sales and marketing alignment depends on agreeing which events matter before either team changes execution.
Table of Contents
How a hidden qualification bottleneck stayed invisible for months
Your research-driven pipeline system and what to do this week
Why your pipeline looks full but revenue stays flat
The usual pattern is easy to recognize. A SaaS team sends targeted sequences through Lemlist, adds LinkedIn touches through Sales Navigator, and watches replies arrive in HubSpot. A manufacturing team sees prospects accept meetings, while a legal tech team reports strong engagement from accounts that never progress beyond an introductory call.
The problem usually isn't a lack of activity. It's that the process measures attention without decision quality. A positive reply can come from someone without buying authority. A held meeting can involve a curious evaluator who has no project, budget, or internal mandate. A booked meeting can still fail because routing takes too long or scheduling creates friction.
Operator rule: Treat every upstream metric as a hypothesis about revenue, not proof of revenue.
Marketing process research should answer four questions in order: where does conversion fall, why does it fall, which signals predict qualified demand, and what intervention can change the result? That sequence prevents the common mistake of buying another tool before checking whether the current workflow records the necessary events.
The global marketing research industry was valued at about $67.5 billion in 2023 and projected to grow at roughly 7.4% annually from 2024 to 2032, according to WorldMetrics' marketing research industry data. The scale matters less than the implication. Research has moved from occasional campaign feedback into a serious operating function for decisions across major markets.
GROU works from that operating view across iGaming, SaaS, manufacturing, legal tech, and pharma. The job is to connect one target list, one message system, one outbound workflow, and one reporting line, then trace each intervention to pipeline quality.
The seven internal metrics to review first
Start with the complete funnel, not open rates or impressions. Export the relevant records from HubSpot, Apollo, Lemlist, Instantly, Smartlead, HeyReach, or the systems your team uses, then define each event before calculating it.
The priority order below prevents a weak metric from hiding a serious downstream problem.
Priority | Metric | What it reveals |
|---|---|---|
1 | End-to-end conversion rates | The exact stage where value drops |
2 | Cost per qualified opportunity | Whether the campaign makes economic sense |
3 | Deliverability and sender reputation | Whether outreach can reach inboxes reliably |
4 | Sales cycle length by stage | Where deals stall and forecasts weaken |
5 | Qualification rate and deal quality | Whether meetings reflect genuine opportunity |
6 | Engagement patterns and response quality | Whether prospects experience relevant outreach |
7 | Attribution and multi-touch patterns | Which channels and signals contribute to pipeline |
Start with conversion economics
Map prospect-to-reply, reply-to-positive-reply, positive-reply-to-meeting-booked, meeting-booked-to-meeting-held, meeting-held-to-qualified-opportunity, and qualified-opportunity-to-closed-won. Review the overall prospect-to-closed rate as well.
Each break points to a different intervention. Weak replies usually suggest targeting or messaging problems. Weak meeting conversion often points to response management. Weak show rates suggest scheduling or expectation issues. Weak qualification can expose poor targeting or inadequate meeting preparation.
Next, calculate cost per qualified opportunity, using fully loaded campaign investment divided by qualified opportunities. Early metrics can look healthy while this measure exposes an uneconomic process. It belongs near the top because it connects execution to pipeline value.
Check the foundation before changing copy
Deliverability comes third because poor sender reputation invalidates downstream analysis. Review bounce rate, spam complaints, domain reputation, inbox placement estimates, and SPF, DKIM, and DMARC alignment. The internal benchmark supplied for this audit framework is a bounce rate under 2%, ideally under 1%, and a spam complaint rate under 0.05%, as outlined in the B2B marketing benchmark guidance.
Then inspect sales cycle length by stage, from first outreach to meeting, meeting to qualified opportunity, qualified opportunity to proposal, and proposal to close. Total cycle length can look normal while one stage consumes forecast time.
Measure quality and channel contribution
Qualification rate, average deal size, win rates on qualified opportunities, and closed-won versus closed-lost characteristics tell you whether the ICP is producing real buying situations. Engagement quality adds context through response type, response timing, comment substance, and post-meeting behavior.
Attribution comes last in the initial pass because it's difficult to interpret before the funnel and definitions are stable. Review first touch, multi-touch contribution, content engagement, referrals, cold sources, and interactions between LinkedIn and email. Teams that need a sharper KPI hierarchy can use this lead generation KPI framework as a reference, then adapt the definitions to their CRM.
The eight-step marketing process audit
A useful audit produces documents, not a collection of opinions. GROU's onboarding audit focuses on outbound and pipeline generation, rather than paid media, SEO, or brand operations outside the planned intervention.
1. Establish the current state
The process starts with a 90-minute discovery workshop. The client CEO or founder, sales leadership, marketing leadership, our engagement lead, and our strategist review the current pipeline approach, team responsibilities, outbound tools, CRM flow, reporting cadence, historical data, goals, and stated challenges.
The output is a current state overview. Skipping this meeting creates a predictable failure: analysts interpret symptoms without understanding ownership, constraints, or the decisions the team already made.
2. Review historical performance
A 5 to 10 hour review covers the last 6 to 12 months of campaign data. We inspect reply, meeting, qualification, close, attribution, deal size, and revenue patterns, using CRM exports, outbound reports, marketing analytics where available, and closed-won and closed-lost analysis.
The deliverable is a performance baseline. It should show where the process works, where it stalls, and which definitions need correction.
3. Audit tools and integrations
Over 3 to 5 hours, review HubSpot or Salesforce, Lemlist, Instantly, Outreach, Sales Navigator, HeyReach, Apollo, ZoomInfo, Clay, reporting infrastructure, Slack, and related systems. Check whether data flows correctly, whether manual work creates delays, and whether duplicate tools obscure ownership.
The output is a tool stack and integration report. A diagram of the current sales process flow chart makes missing handoffs easier to discuss with sales and RevOps.
4. Examine content and messaging
A 4 to 6 hour messaging audit covers subject lines, open rates, body copy, personalization depth, CTAs, sequence cadence, channel coordination, and voice consistency. The question is whether the message reflects the account's situation, not whether it contains a token first-name field.
This produces a messaging audit report. Use evidence from replies and qualified meetings, not internal preference.
5. Inspect prospect intake and signals
Spend 3 to 5 hours examining whether prospects enter through static lists or signal-triggered intake. Review signal quality, enrichment, verification, ICP clarity, prospect volume, and quality measures.
Clay can support signal-based research and enrichment, but a signal isn't useful because it sounds relevant. It needs validation against qualified opportunities and closed-won deals.
6. Audit the sales handoff
A 2 to 4 hour review follows positive replies into sales. Check routing timing, AE preparation, meeting scheduling, follow-up cadence, and deal management discipline. The output is a handoff assessment.
Research teams should also apply basic quality checks for market research data, especially around sampling, missing values, inconsistent definitions, and response quality.
7. Review measurement and reporting
Over 3 to 5 hours, inspect leading and lagging indicators, attribution, reporting frequency, and how metrics drive decisions. The output is a measurement infrastructure assessment.
8. Synthesize the intervention
The final step takes 8 to 12 hours. Findings become a prioritized recommendations document covering current state, bottlenecks, improvement opportunities, intervention approach, expected impact, timeline, investment, and measurement criteria.
Across all eight steps, the total audit typically requires 30 to 50 hours across 2 to 3 weeks, with 8 to 12 hours from client stakeholders. The final report should contain an executive summary, current state assessment, gap analysis, recommendations, and measurement framework.
How a hidden qualification bottleneck stayed invisible for months
A manufacturing client had what looked like a healthy outbound system. Reply rate was 13.2%, positive reply rate was 68%, meeting booking rate was 72%, and meeting show rate was 88%. Qualification rate was only 34%, below the expected 55% to 65% range, so the team was creating interest without enough genuine opportunity.
A routine monthly dashboard review didn't expose the problem. The research had to move from quantitative surface metrics into meeting recordings, closed-deal comparison, signal-to-outcome attribution, and structured conversations with the sales team.
What the deeper review found
We reviewed 20 meetings across successful and unsuccessful outcomes. Interested prospects often weren't decision-makers, while the signal system treated broad topic interest as evidence of buying readiness.
Manufacturing context made the interpretation harder. Prospects accepted meetings out of professional courtesy and genuine interest, so a high show rate didn't mean the meeting involved authority, urgency, or an active project. The team had also carried SaaS assumptions into a vertical with different meeting behavior.
Closed-won analysis clarified the characteristics that separated viable opportunities from curious participants. Signal attribution then showed which inputs produced qualified conversations and which created activity without commercial intent.
High engagement tells you a prospect noticed the topic. It doesn't prove the prospect can buy.
The resolution combined several interventions. Signal criteria were refined, weak signals were removed, Claygent queries checked buying authority, and disqualification signals filtered prospects before meeting acceptance. The booking flow added authority and timeline questions, while meeting agendas addressed qualification earlier.
The team also added qualification rate to weekly monitoring, introduced alerts for degradation, and scheduled recurring deep analysis. After 60 days, qualification rate moved from 34% to 62%, while cost per qualified opportunity moved from €890 to €410. Those figures come from the supplied client example, not a universal benchmark.
Meeting volume decreased 15%, but qualified opportunity volume increased 63%. The lesson is direct: a full calendar can hide an intake problem, and lead qualification process research needs both conversation evidence and conversion data.
The closed-won reverse-engineering framework
Many teams research prospects before outreach and stop there. The more useful loop starts after the deal closes, then works backward through the account, buying group, signals, content, timing, and sales process.
The framework uses standard tools with custom configurations. HubSpot stores deal history, Clay supports enrichment and Claygent research, Notion records patterns and hypotheses, Google Sheets supports comparison, and LinkedIn Sales Navigator provides prospect and buying-group context. There isn't a proprietary AI model behind the method.
Profile the deals that actually closed
For every closed-won account, document the prospect profile, LinkedIn activity in the prior 6 months, company context, buying committee, decision timeline, and initial engagement source. Then compare patterns across deals rather than treating one account as proof.
This often changes the ICP. One client believed employee count defined its target market, but closed-won analysis indicated that funding stage was more predictive. Another client found that engagement with specific thought leaders mattered more than generic LinkedIn activity, producing a reported 45% improvement in qualified opportunity rate after targeting changed.
Turn patterns into tests
Generate hypotheses about buying readiness, ICP structure, committee composition, timing, competitive displacement, content engagement, and role tenure. Test each hypothesis by changing the target list, Clay research prompts, message angle, or sequence timing, then trace the outcome into qualification and closed-won data.
Examples from the supplied client work include identifying three-person buying committees, refining outreach around new-to-role leaders, and finding incumbent displacement patterns that changed positioning. One timing analysis found 78% of deals closed within Q1 or Q3, which led to a revised cadence.
The initial setup requires 26 to 42 hours, including closed-deal analysis, pattern documentation, and hypothesis development. Ongoing work requires roughly 60 to 90 hours annually, with monthly deal review and quarterly pattern refinement.
Research discipline: A hypothesis earns attention only after the CRM can connect it to an outcome.
This method compounds because each new closed deal adds evidence. It also keeps teams honest about the word “proprietary.” The tools are common. The value sits in disciplined reverse-engineering, client-specific judgment, and the willingness to revise assumptions.
Prioritising experiments after the audit
Fix the largest downstream leak first, unless a foundational issue blocks measurement. A practical priority score uses gap severity, pipeline impact, confidence in diagnosis, and intervention cost. A cheap copy test shouldn't outrank a broken reply-routing workflow when positive replies wait for human action.
For most B2B outbound systems, start with signal-based prospect intake when static lists produce weak qualification. Then address reply routing, AI-assisted personalization, meeting scheduling, meeting briefs, and integrated measurement according to the evidence from the audit.
A B2B SaaS audit illustrates the point. Signal-triggered intake through Clay, AI-enhanced personalization, automated Slack routing, meeting scheduling, AI-generated briefs, and integrated measurement were introduced after the audit identified multiple bottlenecks.
The reported movement was:
Reply rate: 6.4% to 15.8%, a 147% improvement.
Meeting rate: 58% to 74%, a 28% improvement.
Show rate: 68% to 84%, a 24% improvement.
Qualification rate: 42% to 68%, a 62% improvement.
Cost per qualified opportunity: €890 to €340, a 62% reduction.
These figures describe that supplied client intervention, not a standard outcome for every account. They show why sequencing matters. Better personalization can't repair poor intake, and better routing can't compensate for a list that produces interested people without buying authority.
For teams exploring AI-assisted search and content workflows, the Nuwtonic Agentic AI SEO Platform is one adjacent option to assess. Keep it separate from the outbound diagnosis unless the audit shows that search visibility or AI-mediated discovery affects the same buying path.
Your research-driven pipeline system and what to do this week
The operator view is simple. Review the seven metrics in priority order, run the eight-step audit when baseline data is missing, reverse-engineer closed-won deals monthly, and rank interventions by downstream gap rather than activity volume.
This approach works across SaaS, iGaming, manufacturing, legal tech, and pharma because it starts with the account's actual workflow. It also gives sales and marketing a shared evidence base for lead generation, instead of separate activity reports.
This week, export your last quarter of closed-won deals from HubSpot and tag each account by source signal, buying committee, role tenure, first meaningful engagement, and qualification outcome. Compare those tags with closed-lost deals, then choose one signal to test and one downstream metric to monitor.
GROU is a global B2B pipeline agency serving teams across iGaming, SaaS, manufacturing, legal tech, and pharma. Its methodology combines funnel diagnostics, tool and integration audits, qualitative review, closed-won reverse-engineering, and prioritized intervention measurement.
Grou helps B2B teams connect LinkedIn content, lead generation, and outbound into one pipeline system, with clear qualification rules and reporting tied to revenue outcomes. Visit Grou to assess the bottleneck in your current workflow and turn the findings into a measured intervention plan.
Your pipeline dashboard says the team is productive. Reply rates look healthy, calendars are full, and AEs have enough meetings to stay busy. Revenue still sits flat because the workflow is leaking value between interest, attendance, qualification, and closed-won business.
Review the seven internal metrics that reveal where the funnel breaks.
Run an eight-step audit across data, tools, messaging, signals, handoff, and reporting.
Use qualitative research to expose bottlenecks hidden by surface activity.
Reverse-engineer closed-won deals so targeting and messaging reflect buying patterns, not assumptions.
Prioritize interventions by downstream impact, not by the volume of activity they create.
This is the operating problem behind most marketing process research. Teams report what happened at the top of the funnel, then treat the dashboard as a diagnosis. A useful process study works backward from qualified opportunities and revenue to identify the specific handoff, signal, or decision that failed.
If your reporting still separates marketing activity from sales outcomes, start by fixing the shared measurement layer. A practical guide to building a growth-driven dashboard can help you frame that work, while sales and marketing alignment depends on agreeing which events matter before either team changes execution.
Table of Contents
How a hidden qualification bottleneck stayed invisible for months
Your research-driven pipeline system and what to do this week
Why your pipeline looks full but revenue stays flat
The usual pattern is easy to recognize. A SaaS team sends targeted sequences through Lemlist, adds LinkedIn touches through Sales Navigator, and watches replies arrive in HubSpot. A manufacturing team sees prospects accept meetings, while a legal tech team reports strong engagement from accounts that never progress beyond an introductory call.
The problem usually isn't a lack of activity. It's that the process measures attention without decision quality. A positive reply can come from someone without buying authority. A held meeting can involve a curious evaluator who has no project, budget, or internal mandate. A booked meeting can still fail because routing takes too long or scheduling creates friction.
Operator rule: Treat every upstream metric as a hypothesis about revenue, not proof of revenue.
Marketing process research should answer four questions in order: where does conversion fall, why does it fall, which signals predict qualified demand, and what intervention can change the result? That sequence prevents the common mistake of buying another tool before checking whether the current workflow records the necessary events.
The global marketing research industry was valued at about $67.5 billion in 2023 and projected to grow at roughly 7.4% annually from 2024 to 2032, according to WorldMetrics' marketing research industry data. The scale matters less than the implication. Research has moved from occasional campaign feedback into a serious operating function for decisions across major markets.
GROU works from that operating view across iGaming, SaaS, manufacturing, legal tech, and pharma. The job is to connect one target list, one message system, one outbound workflow, and one reporting line, then trace each intervention to pipeline quality.
The seven internal metrics to review first
Start with the complete funnel, not open rates or impressions. Export the relevant records from HubSpot, Apollo, Lemlist, Instantly, Smartlead, HeyReach, or the systems your team uses, then define each event before calculating it.
The priority order below prevents a weak metric from hiding a serious downstream problem.
Priority | Metric | What it reveals |
|---|---|---|
1 | End-to-end conversion rates | The exact stage where value drops |
2 | Cost per qualified opportunity | Whether the campaign makes economic sense |
3 | Deliverability and sender reputation | Whether outreach can reach inboxes reliably |
4 | Sales cycle length by stage | Where deals stall and forecasts weaken |
5 | Qualification rate and deal quality | Whether meetings reflect genuine opportunity |
6 | Engagement patterns and response quality | Whether prospects experience relevant outreach |
7 | Attribution and multi-touch patterns | Which channels and signals contribute to pipeline |
Start with conversion economics
Map prospect-to-reply, reply-to-positive-reply, positive-reply-to-meeting-booked, meeting-booked-to-meeting-held, meeting-held-to-qualified-opportunity, and qualified-opportunity-to-closed-won. Review the overall prospect-to-closed rate as well.
Each break points to a different intervention. Weak replies usually suggest targeting or messaging problems. Weak meeting conversion often points to response management. Weak show rates suggest scheduling or expectation issues. Weak qualification can expose poor targeting or inadequate meeting preparation.
Next, calculate cost per qualified opportunity, using fully loaded campaign investment divided by qualified opportunities. Early metrics can look healthy while this measure exposes an uneconomic process. It belongs near the top because it connects execution to pipeline value.
Check the foundation before changing copy
Deliverability comes third because poor sender reputation invalidates downstream analysis. Review bounce rate, spam complaints, domain reputation, inbox placement estimates, and SPF, DKIM, and DMARC alignment. The internal benchmark supplied for this audit framework is a bounce rate under 2%, ideally under 1%, and a spam complaint rate under 0.05%, as outlined in the B2B marketing benchmark guidance.
Then inspect sales cycle length by stage, from first outreach to meeting, meeting to qualified opportunity, qualified opportunity to proposal, and proposal to close. Total cycle length can look normal while one stage consumes forecast time.
Measure quality and channel contribution
Qualification rate, average deal size, win rates on qualified opportunities, and closed-won versus closed-lost characteristics tell you whether the ICP is producing real buying situations. Engagement quality adds context through response type, response timing, comment substance, and post-meeting behavior.
Attribution comes last in the initial pass because it's difficult to interpret before the funnel and definitions are stable. Review first touch, multi-touch contribution, content engagement, referrals, cold sources, and interactions between LinkedIn and email. Teams that need a sharper KPI hierarchy can use this lead generation KPI framework as a reference, then adapt the definitions to their CRM.
The eight-step marketing process audit
A useful audit produces documents, not a collection of opinions. GROU's onboarding audit focuses on outbound and pipeline generation, rather than paid media, SEO, or brand operations outside the planned intervention.
1. Establish the current state
The process starts with a 90-minute discovery workshop. The client CEO or founder, sales leadership, marketing leadership, our engagement lead, and our strategist review the current pipeline approach, team responsibilities, outbound tools, CRM flow, reporting cadence, historical data, goals, and stated challenges.
The output is a current state overview. Skipping this meeting creates a predictable failure: analysts interpret symptoms without understanding ownership, constraints, or the decisions the team already made.
2. Review historical performance
A 5 to 10 hour review covers the last 6 to 12 months of campaign data. We inspect reply, meeting, qualification, close, attribution, deal size, and revenue patterns, using CRM exports, outbound reports, marketing analytics where available, and closed-won and closed-lost analysis.
The deliverable is a performance baseline. It should show where the process works, where it stalls, and which definitions need correction.
3. Audit tools and integrations
Over 3 to 5 hours, review HubSpot or Salesforce, Lemlist, Instantly, Outreach, Sales Navigator, HeyReach, Apollo, ZoomInfo, Clay, reporting infrastructure, Slack, and related systems. Check whether data flows correctly, whether manual work creates delays, and whether duplicate tools obscure ownership.
The output is a tool stack and integration report. A diagram of the current sales process flow chart makes missing handoffs easier to discuss with sales and RevOps.
4. Examine content and messaging
A 4 to 6 hour messaging audit covers subject lines, open rates, body copy, personalization depth, CTAs, sequence cadence, channel coordination, and voice consistency. The question is whether the message reflects the account's situation, not whether it contains a token first-name field.
This produces a messaging audit report. Use evidence from replies and qualified meetings, not internal preference.
5. Inspect prospect intake and signals
Spend 3 to 5 hours examining whether prospects enter through static lists or signal-triggered intake. Review signal quality, enrichment, verification, ICP clarity, prospect volume, and quality measures.
Clay can support signal-based research and enrichment, but a signal isn't useful because it sounds relevant. It needs validation against qualified opportunities and closed-won deals.
6. Audit the sales handoff
A 2 to 4 hour review follows positive replies into sales. Check routing timing, AE preparation, meeting scheduling, follow-up cadence, and deal management discipline. The output is a handoff assessment.
Research teams should also apply basic quality checks for market research data, especially around sampling, missing values, inconsistent definitions, and response quality.
7. Review measurement and reporting
Over 3 to 5 hours, inspect leading and lagging indicators, attribution, reporting frequency, and how metrics drive decisions. The output is a measurement infrastructure assessment.
8. Synthesize the intervention
The final step takes 8 to 12 hours. Findings become a prioritized recommendations document covering current state, bottlenecks, improvement opportunities, intervention approach, expected impact, timeline, investment, and measurement criteria.
Across all eight steps, the total audit typically requires 30 to 50 hours across 2 to 3 weeks, with 8 to 12 hours from client stakeholders. The final report should contain an executive summary, current state assessment, gap analysis, recommendations, and measurement framework.
How a hidden qualification bottleneck stayed invisible for months
A manufacturing client had what looked like a healthy outbound system. Reply rate was 13.2%, positive reply rate was 68%, meeting booking rate was 72%, and meeting show rate was 88%. Qualification rate was only 34%, below the expected 55% to 65% range, so the team was creating interest without enough genuine opportunity.
A routine monthly dashboard review didn't expose the problem. The research had to move from quantitative surface metrics into meeting recordings, closed-deal comparison, signal-to-outcome attribution, and structured conversations with the sales team.
What the deeper review found
We reviewed 20 meetings across successful and unsuccessful outcomes. Interested prospects often weren't decision-makers, while the signal system treated broad topic interest as evidence of buying readiness.
Manufacturing context made the interpretation harder. Prospects accepted meetings out of professional courtesy and genuine interest, so a high show rate didn't mean the meeting involved authority, urgency, or an active project. The team had also carried SaaS assumptions into a vertical with different meeting behavior.
Closed-won analysis clarified the characteristics that separated viable opportunities from curious participants. Signal attribution then showed which inputs produced qualified conversations and which created activity without commercial intent.
High engagement tells you a prospect noticed the topic. It doesn't prove the prospect can buy.
The resolution combined several interventions. Signal criteria were refined, weak signals were removed, Claygent queries checked buying authority, and disqualification signals filtered prospects before meeting acceptance. The booking flow added authority and timeline questions, while meeting agendas addressed qualification earlier.
The team also added qualification rate to weekly monitoring, introduced alerts for degradation, and scheduled recurring deep analysis. After 60 days, qualification rate moved from 34% to 62%, while cost per qualified opportunity moved from €890 to €410. Those figures come from the supplied client example, not a universal benchmark.
Meeting volume decreased 15%, but qualified opportunity volume increased 63%. The lesson is direct: a full calendar can hide an intake problem, and lead qualification process research needs both conversation evidence and conversion data.
The closed-won reverse-engineering framework
Many teams research prospects before outreach and stop there. The more useful loop starts after the deal closes, then works backward through the account, buying group, signals, content, timing, and sales process.
The framework uses standard tools with custom configurations. HubSpot stores deal history, Clay supports enrichment and Claygent research, Notion records patterns and hypotheses, Google Sheets supports comparison, and LinkedIn Sales Navigator provides prospect and buying-group context. There isn't a proprietary AI model behind the method.
Profile the deals that actually closed
For every closed-won account, document the prospect profile, LinkedIn activity in the prior 6 months, company context, buying committee, decision timeline, and initial engagement source. Then compare patterns across deals rather than treating one account as proof.
This often changes the ICP. One client believed employee count defined its target market, but closed-won analysis indicated that funding stage was more predictive. Another client found that engagement with specific thought leaders mattered more than generic LinkedIn activity, producing a reported 45% improvement in qualified opportunity rate after targeting changed.
Turn patterns into tests
Generate hypotheses about buying readiness, ICP structure, committee composition, timing, competitive displacement, content engagement, and role tenure. Test each hypothesis by changing the target list, Clay research prompts, message angle, or sequence timing, then trace the outcome into qualification and closed-won data.
Examples from the supplied client work include identifying three-person buying committees, refining outreach around new-to-role leaders, and finding incumbent displacement patterns that changed positioning. One timing analysis found 78% of deals closed within Q1 or Q3, which led to a revised cadence.
The initial setup requires 26 to 42 hours, including closed-deal analysis, pattern documentation, and hypothesis development. Ongoing work requires roughly 60 to 90 hours annually, with monthly deal review and quarterly pattern refinement.
Research discipline: A hypothesis earns attention only after the CRM can connect it to an outcome.
This method compounds because each new closed deal adds evidence. It also keeps teams honest about the word “proprietary.” The tools are common. The value sits in disciplined reverse-engineering, client-specific judgment, and the willingness to revise assumptions.
Prioritising experiments after the audit
Fix the largest downstream leak first, unless a foundational issue blocks measurement. A practical priority score uses gap severity, pipeline impact, confidence in diagnosis, and intervention cost. A cheap copy test shouldn't outrank a broken reply-routing workflow when positive replies wait for human action.
For most B2B outbound systems, start with signal-based prospect intake when static lists produce weak qualification. Then address reply routing, AI-assisted personalization, meeting scheduling, meeting briefs, and integrated measurement according to the evidence from the audit.
A B2B SaaS audit illustrates the point. Signal-triggered intake through Clay, AI-enhanced personalization, automated Slack routing, meeting scheduling, AI-generated briefs, and integrated measurement were introduced after the audit identified multiple bottlenecks.
The reported movement was:
Reply rate: 6.4% to 15.8%, a 147% improvement.
Meeting rate: 58% to 74%, a 28% improvement.
Show rate: 68% to 84%, a 24% improvement.
Qualification rate: 42% to 68%, a 62% improvement.
Cost per qualified opportunity: €890 to €340, a 62% reduction.
These figures describe that supplied client intervention, not a standard outcome for every account. They show why sequencing matters. Better personalization can't repair poor intake, and better routing can't compensate for a list that produces interested people without buying authority.
For teams exploring AI-assisted search and content workflows, the Nuwtonic Agentic AI SEO Platform is one adjacent option to assess. Keep it separate from the outbound diagnosis unless the audit shows that search visibility or AI-mediated discovery affects the same buying path.
Your research-driven pipeline system and what to do this week
The operator view is simple. Review the seven metrics in priority order, run the eight-step audit when baseline data is missing, reverse-engineer closed-won deals monthly, and rank interventions by downstream gap rather than activity volume.
This approach works across SaaS, iGaming, manufacturing, legal tech, and pharma because it starts with the account's actual workflow. It also gives sales and marketing a shared evidence base for lead generation, instead of separate activity reports.
This week, export your last quarter of closed-won deals from HubSpot and tag each account by source signal, buying committee, role tenure, first meaningful engagement, and qualification outcome. Compare those tags with closed-lost deals, then choose one signal to test and one downstream metric to monitor.
GROU is a global B2B pipeline agency serving teams across iGaming, SaaS, manufacturing, legal tech, and pharma. Its methodology combines funnel diagnostics, tool and integration audits, qualitative review, closed-won reverse-engineering, and prioritized intervention measurement.
Grou helps B2B teams connect LinkedIn content, lead generation, and outbound into one pipeline system, with clear qualification rules and reporting tied to revenue outcomes. Visit Grou to assess the bottleneck in your current workflow and turn the findings into a measured intervention plan.

Pipeline OS Newsletter
Build qualified pipeline
Get weekly tactics to generate demand, improve lead quality, and book more meetings.





Trusted by industry leaders
Trusted by industry leaders
Trusted by industry leaders
Ready to build qualified pipeline?
Ready to build qualified pipeline?
Ready to build qualified pipeline?
Book a call to see if we're the right fit, or take the 2-minute quiz to get a clear starting point.
Book a call to see if we're the right fit, or take the 2-minute quiz to get a clear starting point.
Book a call to see if we're the right fit, or take the 2-minute quiz to get a clear starting point.
" height="30.21639343089746px" id="hfGbXmQR2" width="30.216393430897455px"/></svg>)
Copyright © 2026 – All Right Reserved
Company
Resources
Copyright © 2026 – All Right Reserved
Copyright © 2026 – All Right Reserved